Edvancer's Knowledge Hub
A simple guide to Hypothesis Testing
Inferential statistics help us to infer unknown properties or behaviour of a larger population by studying a representative sample, using various statistical testing procedures. For example, studying the effects of a new treatment over a small group of people to test if it performs better or worse than the standard treatment, or inferring ratings of a movie from the viewers’ comments and reviews.
Inference can be deduced by two methods — 1. Estimation ( Point & Interval), and, 2. Hypothesis Testing. Estimation refers to estimating a parameter of interest (like mean, standard deviation) based on information from a randomly chosen sample. Hypothesis testing refers to testing claims or statements about a group or population using the data from the chosen sample.
In this article, we will focus on understanding the Hypothesis testing.
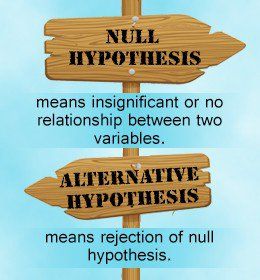
A statistical hypothesis could be defined as a statement about a population parameter (e.g., mean, median, mode, variance, standard deviation, proportion, total), or a statement about the kind of probability distribution that a certain variable obeys. Based on a sample from the population, a statistical test is conducted to make a binary decision on the proposed hypothesis, denoted by Ho: reject Ho or not reject Ho.
Hypothesis testing process can be summarised in the following steps:
1. State the hypothesis: A hypothesis test begins by stating two mutually exclusive statements about the population. One is known as the Null Hypothesis ( Ho) which is the population parameter value like the population mean, which is presumed to be true unless proven otherwise. The contradicting statement to the Null Hypothesis is known as Alternative Hypothesis ( Ha) and states that the actual value of a population parameter is less than (left-tailed test), greater than ( right-tailed test), or not equal to the value stated in the null hypothesis (two-tailed hypothesis test).The Null hypothesis is assumed to be correct, so the focus of the test should be to demonstrate that the Null Hypothesis is unlikely to be correct.
2. Set the decision criteria: The decision criteria known as the Significance level (alpha) is the probability of obtaining a sample statistics if the value stated in the null hypothesis is true. The level of significance are usually set at 10% (0.1), 5% (0.05)or 1% (0.01). The null hypothesis is to be rejected if the probability of obtaining a sample mean is less than the value of alpha if the null hypothesis were true.
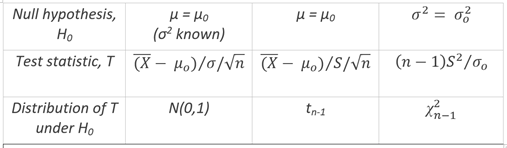
3. Compute the test statistics: A test statistics is computed on the sample data and compared to the population parameter (value assumed to be true in the Null Hypothesis). The value given by this test gives a measure of how far away (in terms of the number of standard deviation) the sample mean is from the population mean. Common test statistics used in hypothesis testing are t-tests and z-tests. t-tests are used when the sample size is smaller and the population standard deviation is unknown while z-tests are used for larger samples and a known population standard deviation. (For more tests and details, check the link https://en.wikipedia.org/wiki/Test_statistic#Common_test_statistics )
4. Compute the p-value, or find the critical/rejection region: p-value is computed using the test statistics. The p-value is the probability of observing a sample statistic that is at least as extreme as your sample statistic when you assume that the null hypothesis is true. Simply put, p-value measures the discrepancy or contradiction between the Null hypothesis and the sample data.
The rejection region is determined by the significance level, it is the region beyond the critical value cutoff. The critical value is the value that divides the region into the acceptance region and rejection region.
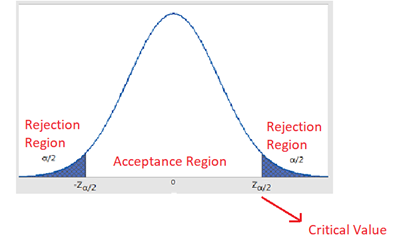 Acceptance & Rejection regions for a two-tailed test at significance level α
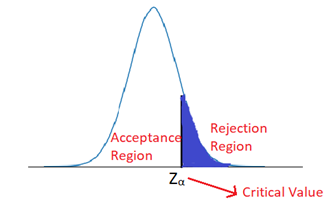 Acceptance & Rejection regions for a one-tailed test at significance level α
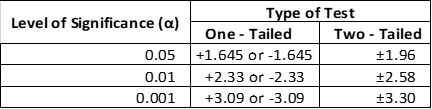 Critical values for one– and two-tailed tests at three commonly used levels of significance
5. Make a decision: A decision can be made on the basis of either the p-value or the critical region.
Based on the p-value, if:
- p-value ≤ alpha indicates that Ho is not supported by the sample data i.e. Ho should be rejected.
- p-value > alpha indicates that Ho is not inconsistent with the sample data i.e. Ho should be not rejected.
A test is significant if the p-value is less than the specified significance level and the decision is to reject the null hypothesis. When the p-value is greater than .05, we fail to reach significance; the decision is to retain the null hypothesis.
Based on the critical region, if the value of test statistics given by the sample lies in the critical region then the Ho is rejected, otherwise, Ho is not rejected.
In order to make a test powerful in the sense that the chance of making an incorrect decision is small, the critical region should consist of those values of test statistics which are least supportive of Ho (i.e. which lie in the direction of Ha).
Types of Error while making a decision
Since the decision is made on the basis of a sample and not the entire population or group, it is possible to make errors in concluding the null hypothesis.
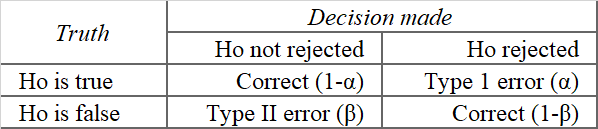
Type I error is committed if we reject a true Null hypothesis, Ho. Type II error happens when we fail to reject a false Null hypothesis.
The probability of making a Type 1 error is the significance level which is under our control. We do not have explicit control over the probability of a Type II error. For a given significance level, we try to choose a test statistic such that the probability of a Type II error is small.
The correct decision is to reject a false null hypothesis. This decision is called the power of the test. The power function of the test can be defined as
power function = 1 − P(Type II error) or (1-β).
Thus, the power in hypothesis testing is the probability that a randomly selected sample will show that the null hypothesis is false when the null hypothesis is in fact false.
Underlying Assumptions of Hypothesis Testing
Statistical hypothesis testing requires several assumptions like the method of sampling the data, the shape of the population distribution, and the sample size. The specific assumptions may vary, depending on the test or the conditions of testing. However, without exception, all statistical tests assume random sampling. Tests of hypotheses about means require that the population under consideration be normally distributed or that the sample size be larger than 50 because if the sample size is sufficiently large (N > 50), basing on the central limit theorem, the probabilities of all other possible sample means we could select would be normally distributed.
To summarise, one should define the Null and Alternate hypothesis carefully, and compute the test statistics based on the underlying assumptions for the sampling distribution of the sample mean, and make a decision to reject or not reject the null hypothesis based on either the p-value and significance level, or the critical value and the computed test statistics value.
References:
https://www.sagepub.com/sites/default/files/upm-binaries/40007_Chapter8.pdf
https://stattrek.com/hypothesis-test/hypothesis-testing.aspx?Tutorial=AP
https://www.ischool.utexas.edu/~wyllys/IRLISMaterials/stathyp.pdf
Latest posts by Yogita Kinha (see all)
- A simple guide to Hypothesis Testing - September 24, 2019
- Accelerate your job search with Word cloud in Python - September 22, 2019
- AI revolution in Healthcare industry - September 8, 2019
Follow us on
