Edvancer's Knowledge Hub
Step-by-step guide to execute Linear Regression in Python

In my previous post, I explained the concept of linear regression using R. In this post, I will explain how to implement linear regression using Python. I am going to use a Python library called Scikit Learn to execute Linear Regression.
Scikit-learn is a powerful Python module for machine learning and it comes with default data sets. I will use one such default data set called Boston Housing, the data set contains information about the housing values in suburbs of Boston.
Introduction
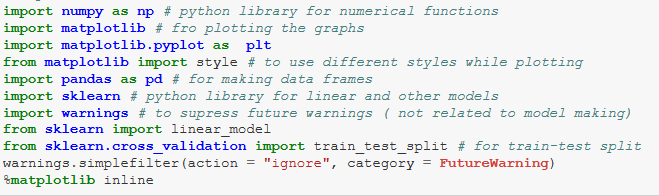
In my step by step guide to Python for data science article, I have explained how to install Python and the most commonly used libraries for data science. Go through this post to understand the commonly used Python libraries.
 Linear Regression using two dimensional data
First, let’s understand Linear Regression using just one dependent and independent variable.
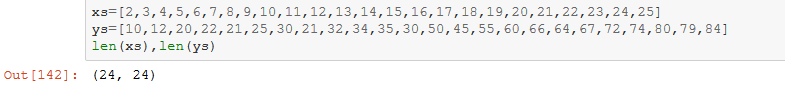
I create two lists xs and ys.
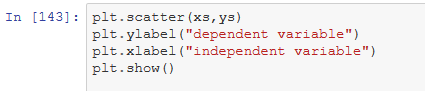
I plot these lists using a scatter plot. I assume xs as the independent variable and ys as the dependent variable.
You can see that the dependent variable has a linear distribution with respect to the independent variable.
A linear regression line has the equation Y = mx+c, where m is the coefficient of independent variable and c is the intercept.
The mathematical formula to calculate slope (m) is:
(mean(x) * mean(y) – mean(x*y)) / ( mean (x)^2 – mean( x^2))
The formula to calculate intercept (c) is:
mean(y) – mean(x) * m
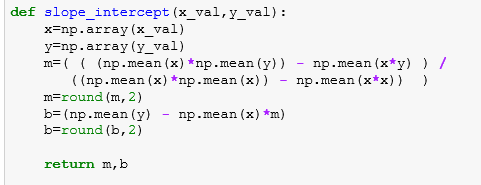
Now, let’s write a function for intercept and slope (coefficient):
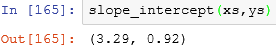
To see the slope and intercept for xs and ys, we just need to call the function slope_intercept:
reg_line is the equation of the regression line:
Now, let’s plot a regression line on xs and ys:
Root Mean Squared Error(RMSE)
RMSE is the standard deviation of the residuals (prediction errors). Residuals are a measure of how far from the regression line data points are, and RMSE is a measure of how spread out these residuals are.
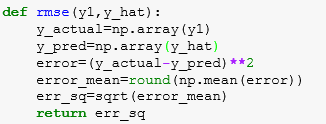
If Yi is the actual data point and Y^i is the predicted value by the equation of line then RMSE is the square root of (Yi – Y^i)**2
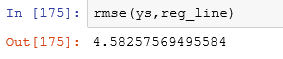
Let’s define a function for RMSE:
Linear Regression using Scikit Learn
Now, let’s run Linear Regression on Boston housing data set to predict the housing prices using different variables.
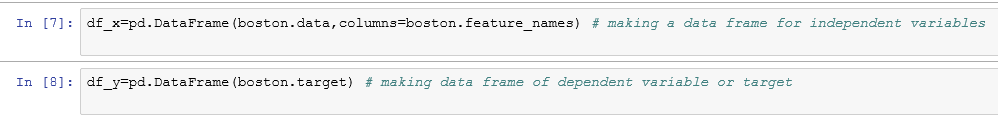
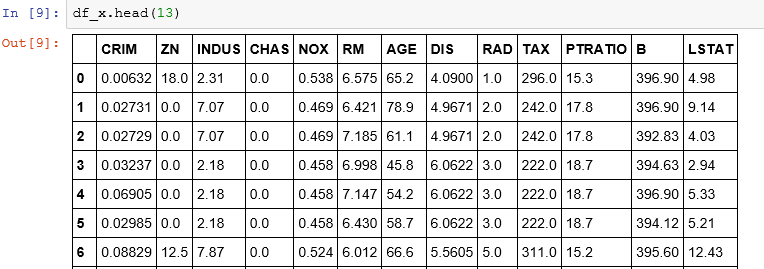
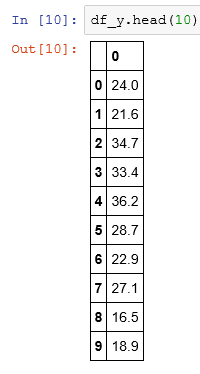
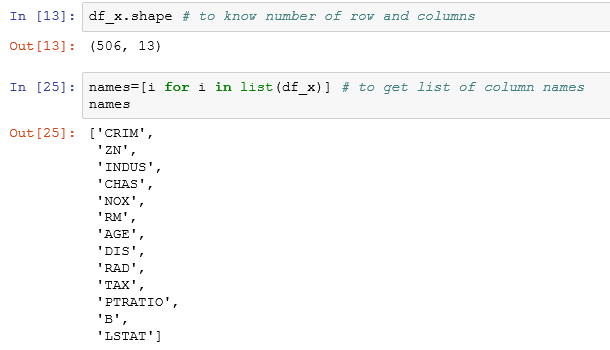
I create a Pandas data frame for independent and dependent variables. The boston.target is the housing prices.
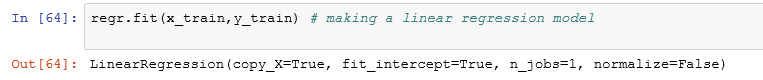
Now, I am calling a linear regression model.
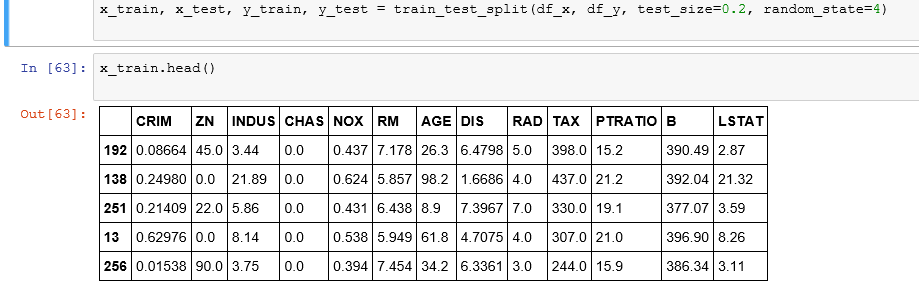
In practice you won’t implement linear regression on the entire data set, you will have to split the data sets into training and test data. So that you train your model on training data and see how well it performed on test data.
I use 20 percentage of the total data as my test data.
I fit the linear regression model to the training data set.
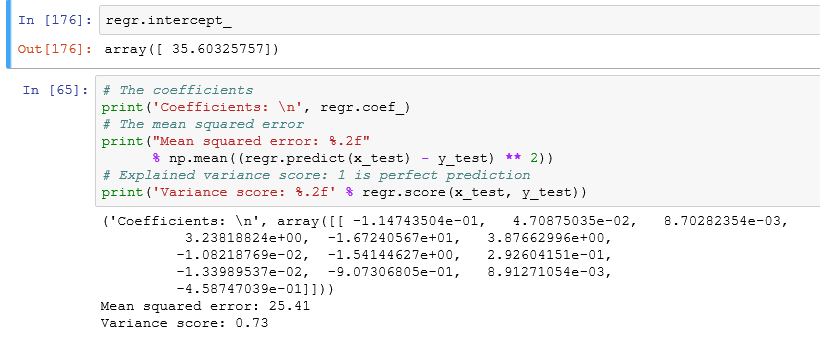
Let’s calculate the intercept value, mean squared error, coefficients, and the variance score.
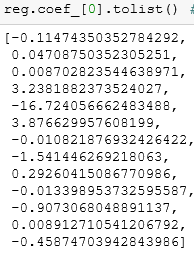
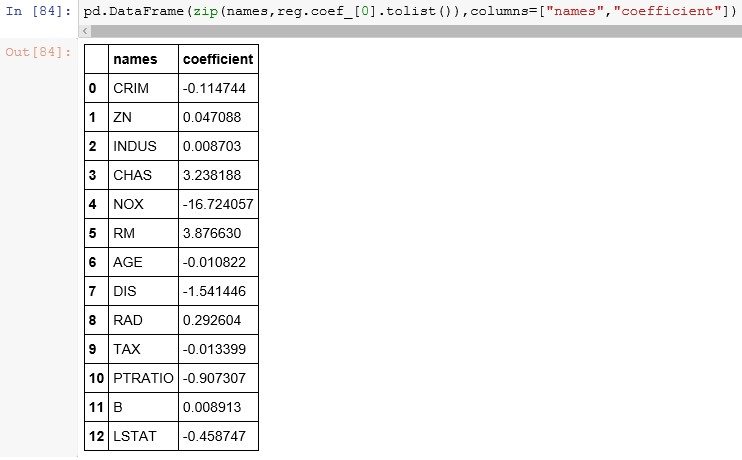
These are the coefficients of Independent variables (slope (m) of the regression line).
I attach the slopes to the respective independent variables.
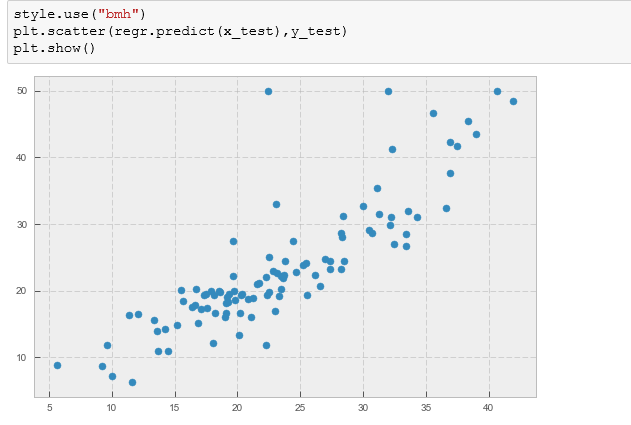
I plot the predicted x_test and y_test values.
Select only the important variables for the model.
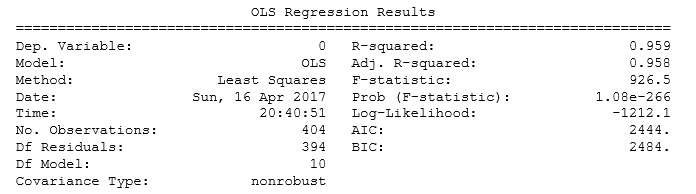
Scikit-learn is a good way to plot a linear regression but if we are considering linear regression for modelling purposes then we need to know the importance of variables( significance) with respect to the hypothesis.
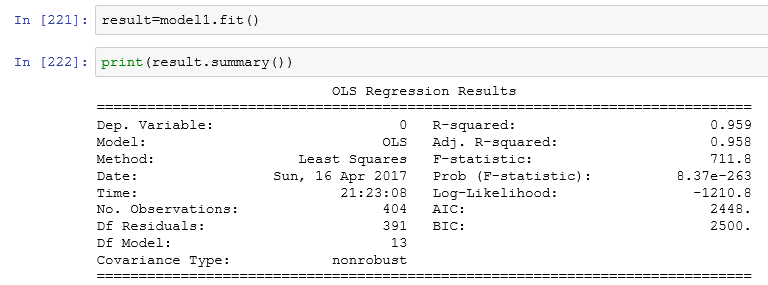
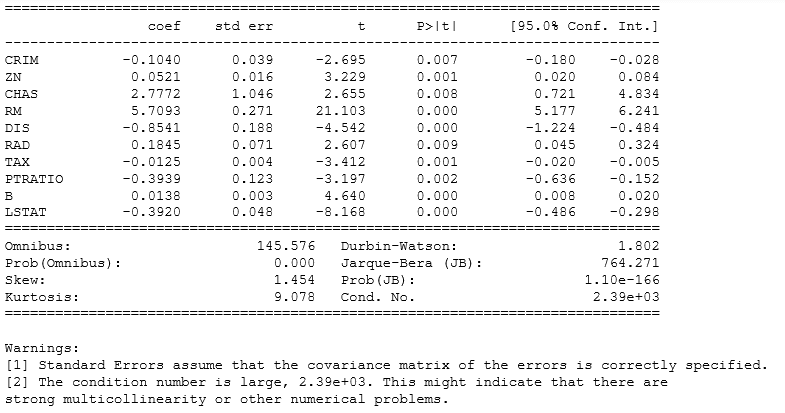
To do this, we need to calculate the p value for each variable and if it is less than the desired cutoff( 0.05 is the general cut off for 95% significance) then we can say with confidence that a variable is significant. We can calculate the p-value using another library called ‘statsmodels’.
Ordinary least squares or linear least squares is a method for estimating the unknown parameters in a linear regression model. We have explained the OLS method in the first part of the tutorial.
model1=sm.OLS(y_train,x_train)
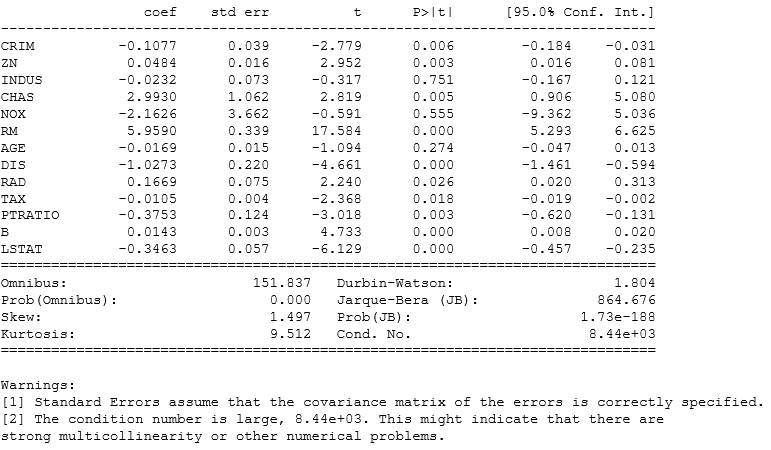
We can drop few variables and select only those that have p values < 0.5 and then we can check improvement in the model.
A general approach to compare two different models is AIC( Akaike Information Criteria) and the model with minimum AIC is the best one.
Dealing with multicollinearity
Multicollinearity is problem that you can run into when you’re fitting a regression model. Simply put, multicollinearity is when two or more independent variables in a regression are highly related to one another, such that they do not provide unique or independent information to the regression.
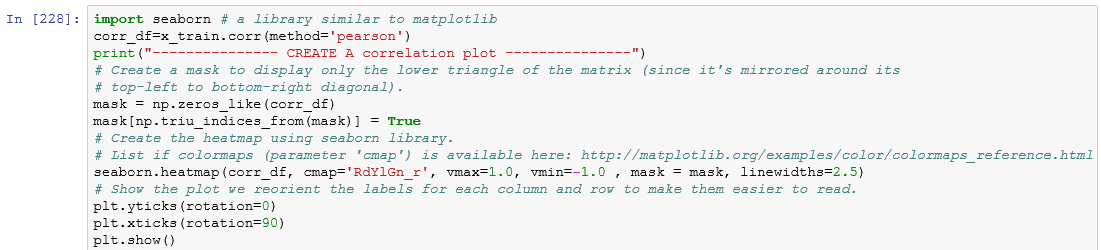
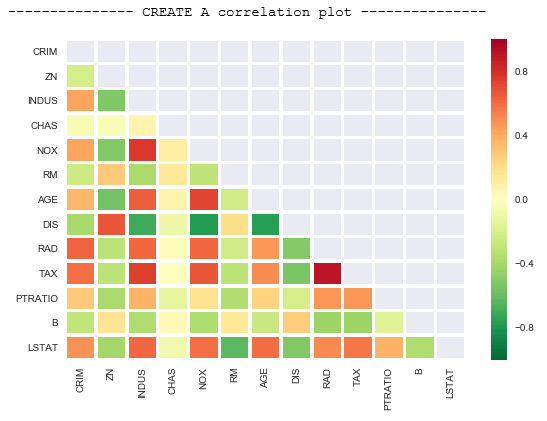
We can check multicollinearity using this command: corr(method = “name of method”). I am going to make a correlation plot to see which parameters have multicollinearity issue.
Since this is a Pearson Coefficient, the values near to 1 or -1 have high correlation. For example, we can drop AGE and DIS and then execute a linear regression model to see if there are any improvements.
Linear Regression using two dimensional data
First, let’s understand Linear Regression using just one dependent and independent variable.
I create two lists xs and ys.
I plot these lists using a scatter plot. I assume xs as the independent variable and ys as the dependent variable.
You can see that the dependent variable has a linear distribution with respect to the independent variable.
A linear regression line has the equation Y = mx+c, where m is the coefficient of independent variable and c is the intercept.
The mathematical formula to calculate slope (m) is:
(mean(x) * mean(y) – mean(x*y)) / ( mean (x)^2 – mean( x^2))
The formula to calculate intercept (c) is:
mean(y) – mean(x) * m
Now, let’s write a function for intercept and slope (coefficient):
To see the slope and intercept for xs and ys, we just need to call the function slope_intercept:
reg_line is the equation of the regression line:
Now, let’s plot a regression line on xs and ys:
Root Mean Squared Error(RMSE)
RMSE is the standard deviation of the residuals (prediction errors). Residuals are a measure of how far from the regression line data points are, and RMSE is a measure of how spread out these residuals are.
If Yi is the actual data point and Y^i is the predicted value by the equation of line then RMSE is the square root of (Yi – Y^i)**2
Let’s define a function for RMSE:
Linear Regression using Scikit Learn
Now, let’s run Linear Regression on Boston housing data set to predict the housing prices using different variables.
I create a Pandas data frame for independent and dependent variables. The boston.target is the housing prices.
Now, I am calling a linear regression model.
In practice you won’t implement linear regression on the entire data set, you will have to split the data sets into training and test data. So that you train your model on training data and see how well it performed on test data.
I use 20 percentage of the total data as my test data.
I fit the linear regression model to the training data set.
Let’s calculate the intercept value, mean squared error, coefficients, and the variance score.
These are the coefficients of Independent variables (slope (m) of the regression line).
I attach the slopes to the respective independent variables.
I plot the predicted x_test and y_test values.
Select only the important variables for the model.
Scikit-learn is a good way to plot a linear regression but if we are considering linear regression for modelling purposes then we need to know the importance of variables( significance) with respect to the hypothesis.
To do this, we need to calculate the p value for each variable and if it is less than the desired cutoff( 0.05 is the general cut off for 95% significance) then we can say with confidence that a variable is significant. We can calculate the p-value using another library called ‘statsmodels’.
Ordinary least squares or linear least squares is a method for estimating the unknown parameters in a linear regression model. We have explained the OLS method in the first part of the tutorial.
model1=sm.OLS(y_train,x_train)
We can drop few variables and select only those that have p values < 0.5 and then we can check improvement in the model.
A general approach to compare two different models is AIC( Akaike Information Criteria) and the model with minimum AIC is the best one.
Dealing with multicollinearity
Multicollinearity is problem that you can run into when you’re fitting a regression model. Simply put, multicollinearity is when two or more independent variables in a regression are highly related to one another, such that they do not provide unique or independent information to the regression.
We can check multicollinearity using this command: corr(method = “name of method”). I am going to make a correlation plot to see which parameters have multicollinearity issue.
Since this is a Pearson Coefficient, the values near to 1 or -1 have high correlation. For example, we can drop AGE and DIS and then execute a linear regression model to see if there are any improvements.

Share this on
Follow us on
 Linear Regression using two dimensional data
First, let’s understand Linear Regression using just one dependent and independent variable.
I create two lists xs and ys.
Linear Regression using two dimensional data
First, let’s understand Linear Regression using just one dependent and independent variable.
I create two lists xs and ys.
 I plot these lists using a scatter plot. I assume xs as the independent variable and ys as the dependent variable.
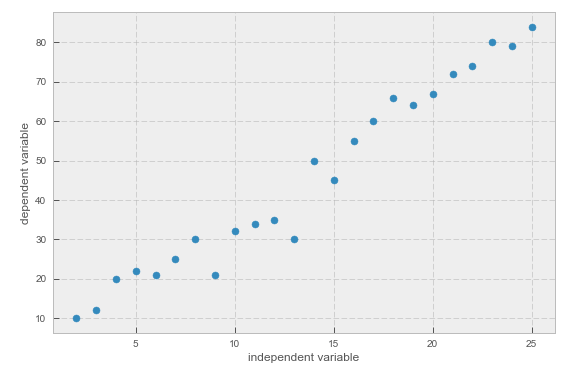 You can see that the dependent variable has a linear distribution with respect to the independent variable.
A linear regression line has the equation Y = mx+c, where m is the coefficient of independent variable and c is the intercept.
The mathematical formula to calculate slope (m) is:
(mean(x) * mean(y) – mean(x*y)) / ( mean (x)^2 – mean( x^2))
The formula to calculate intercept (c) is:
mean(y) – mean(x) * m
Now, let’s write a function for intercept and slope (coefficient):
You can see that the dependent variable has a linear distribution with respect to the independent variable.
A linear regression line has the equation Y = mx+c, where m is the coefficient of independent variable and c is the intercept.
The mathematical formula to calculate slope (m) is:
(mean(x) * mean(y) – mean(x*y)) / ( mean (x)^2 – mean( x^2))
The formula to calculate intercept (c) is:
mean(y) – mean(x) * m
Now, let’s write a function for intercept and slope (coefficient):
 To see the slope and intercept for xs and ys, we just need to call the function slope_intercept:
 Root Mean Squared Error(RMSE)
RMSE is the standard deviation of the residuals (prediction errors). Residuals are a measure of how far from the regression line data points are, and RMSE is a measure of how spread out these residuals are.
If Yi is the actual data point and Y^i is the predicted value by the equation of line then RMSE is the square root of (Yi – Y^i)**2
Let’s define a function for RMSE:
Root Mean Squared Error(RMSE)
RMSE is the standard deviation of the residuals (prediction errors). Residuals are a measure of how far from the regression line data points are, and RMSE is a measure of how spread out these residuals are.
If Yi is the actual data point and Y^i is the predicted value by the equation of line then RMSE is the square root of (Yi – Y^i)**2
Let’s define a function for RMSE:
 Linear Regression using Scikit Learn
Now, let’s run Linear Regression on Boston housing data set to predict the housing prices using different variables.
Linear Regression using Scikit Learn
Now, let’s run Linear Regression on Boston housing data set to predict the housing prices using different variables.
 Now, I am calling a linear regression model.
 I fit the linear regression model to the training data set.
 Let’s calculate the intercept value, mean squared error, coefficients, and the variance score.
 These are the coefficients of Independent variables (slope (m) of the regression line).
 I attach the slopes to the respective independent variables.
 I plot the predicted x_test and y_test values.
 Select only the important variables for the model.
Scikit-learn is a good way to plot a linear regression but if we are considering linear regression for modelling purposes then we need to know the importance of variables( significance) with respect to the hypothesis.
To do this, we need to calculate the p value for each variable and if it is less than the desired cutoff( 0.05 is the general cut off for 95% significance) then we can say with confidence that a variable is significant. We can calculate the p-value using another library called ‘statsmodels’.
Select only the important variables for the model.
Scikit-learn is a good way to plot a linear regression but if we are considering linear regression for modelling purposes then we need to know the importance of variables( significance) with respect to the hypothesis.
To do this, we need to calculate the p value for each variable and if it is less than the desired cutoff( 0.05 is the general cut off for 95% significance) then we can say with confidence that a variable is significant. We can calculate the p-value using another library called ‘statsmodels’.
 We can drop few variables and select only those that have p values < 0.5 and then we can check improvement in the model.
A general approach to compare two different models is AIC( Akaike Information Criteria) and the model with minimum AIC is the best one.
We can drop few variables and select only those that have p values < 0.5 and then we can check improvement in the model.
A general approach to compare two different models is AIC( Akaike Information Criteria) and the model with minimum AIC is the best one.

 Dealing with multicollinearity
Multicollinearity is problem that you can run into when you’re fitting a regression model. Simply put, multicollinearity is when two or more independent variables in a regression are highly related to one another, such that they do not provide unique or independent information to the regression.
We can check multicollinearity using this command: corr(method = “name of method”). I am going to make a correlation plot to see which parameters have multicollinearity issue.
Dealing with multicollinearity
Multicollinearity is problem that you can run into when you’re fitting a regression model. Simply put, multicollinearity is when two or more independent variables in a regression are highly related to one another, such that they do not provide unique or independent information to the regression.
We can check multicollinearity using this command: corr(method = “name of method”). I am going to make a correlation plot to see which parameters have multicollinearity issue.
 Since this is a Pearson Coefficient, the values near to 1 or -1 have high correlation. For example, we can drop AGE and DIS and then execute a linear regression model to see if there are any improvements.
Manu Jeevan
Manu Jeevan is a self-taught data scientist and loves to explain data science concepts in simple terms. You can connect with him on LinkedIn, or email him at manu@bigdataexaminer.com.
Latest posts by Manu Jeevan (see all)
- Python IDEs for Data Science: Top 5 - January 19, 2019
- The 5 exciting machine learning, data science and big data trends for 2019 - January 19, 2019
- A/B Testing Made Simple – Part 2 - October 30, 2018
Follow us on
Free Data Science & AI Starter Course
